Dashboard
This is the main dashboard where the magic starts. You can navigate machine and software data from here alongside Mata Inventive’s AI engine. Several critical functions are baked into this page, which will be discussed below in detail.
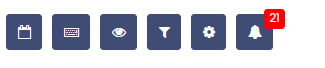
Top Section Buttons

Refresh
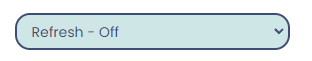
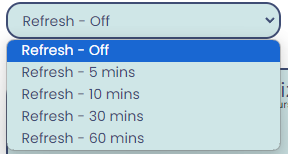
This feature facilitates the automated refresh of the dashboard at predefined intervals, as delineated in the dropdown menu and corresponding image provided above.
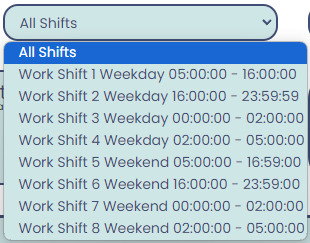
Shifts
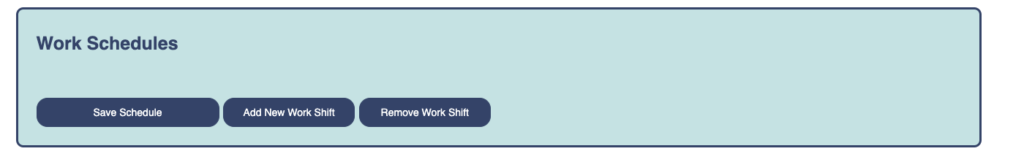
This functionality displays comprehensive shift information, encompassing both weekday and weekend schedules. Users can configure their specific shifts within this interface. The menu on the right is where all the shifts are added.
Start
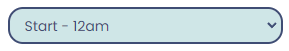
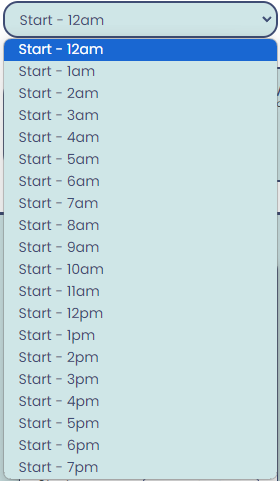
This capability empowers the commencement of facility operations on a 24-hour basis.
Date Filter

As elaborated below, this functionality adjusts the displayed time range, offering three distinct states.
- Today – This displays the data for today
- Yesterday – This shows the data for yesterday
- Week – This shows the data for the current week
Filters
This section provides comprehensive definitions for all filters, data reporting processes, and options for implementing data sorting and reporting functionalities.
Report Date
This will set the date for the associative data.
Upon selecting a date using the record date button, the corresponding data will be seamlessly loaded into the dashboard, as exemplified above, facilitating subsequent analysis.
Report Email
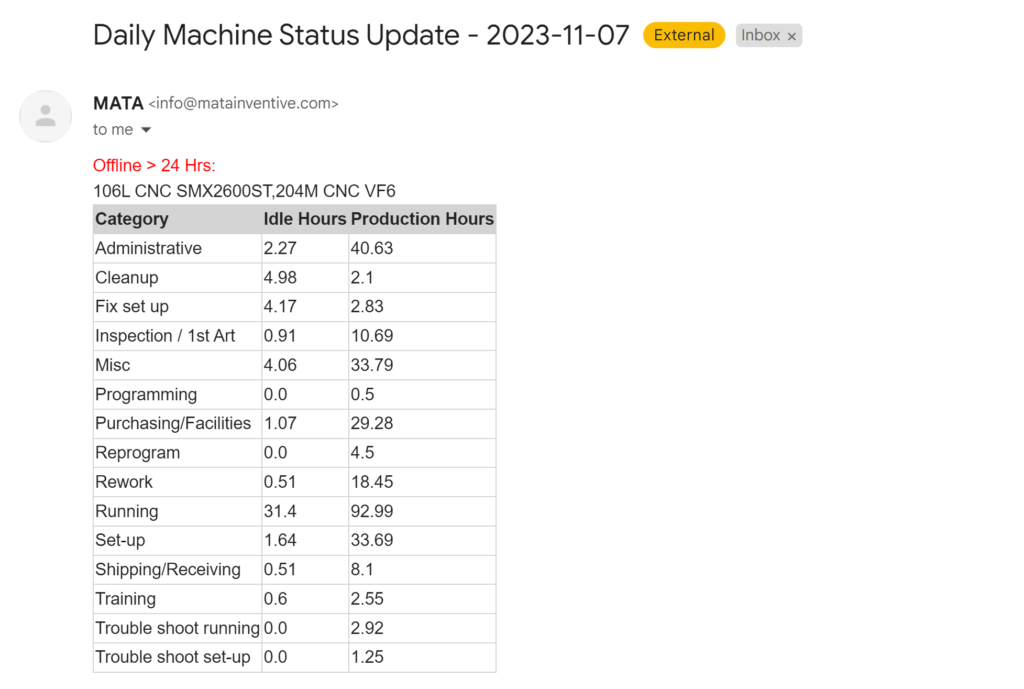
This functionality initiates the transmission of a comprehensive report for the selected date to the user’s email. The report encompasses a complete set of information and machine metrics, accompanied by attached documents for reference and processing. An illustrative example of such a report has been provided above.
Unscanned Hours

This AI feature enables a factory to find time when the machine is running but there is no job record in correspondence.
Display Setting


This filter serves the dual purpose of configuring and reporting all numerical data on the main dashboard. It allows users to selectively include or exclude sections based on specified options, offering a personalized means to customize the dashboard according to individual preferences.
Below are descriptions of all the functions available in the display options menu.
Utilization, Leverage, Efficiency Display

This toggle enables the switching on and off the main dashboard’s efficiency, utilization, and efficiency summary, providing flexibility in customizing the displayed information.
Employee Display

This button serves to toggle the Employee section of the dashboard on and off the main display, allowing users to customize the visibility of this particular component.
Alarm – Summary Display

This button functions as a toggle, allowing users to switch the Alarm summary section of the dashboard on and off the main display, providing a convenient way to control the visibility of this specific component.
Machine Info Display

This button serves as a toggle to enable or disable the visibility of the machine info section on the main dashboard display, giving users the flexibility to customize their dashboard view.
Machine Utilization Display

This button acts as a toggle to switch the visibility of the machine utilization section on and off the main dashboard display, giving users the flexibility to customize their dashboard presentation.
Machine Leverage Display

This button serves as a toggle to activate or deactivate the visibility of the machine leverage section on the main dashboard display, offering users the flexibility to customize their dashboard view.
Machine Efficiency Display

This button functions as a toggle to enable or disable the visibility of the machine efficiency section on the main dashboard display, allowing users to customize their dashboard view according to their preferences.
Machine Image Display

This button serves as a toggle, enabling users to switch the visibility of the machine image section on and off the main dashboard display, offering a convenient means to customize the dashboard view.
Machine Production Hours Display

This button operates as a toggle, allowing users to turn the machine production hours section on or off on the main dashboard display, providing a flexible approach to customize the dashboard view.
Meas., Reported., Sched.

This button functions as a toggle, enabling users to switch the visibility of the machine Meas, Reported, and Sched sections on and off the main dashboard display, offering a flexible means to customize the dashboard view.
Machine Rate Display

This button acts as a toggle, allowing users to turn the machine rate section on or off on the main dashboard display, providing a convenient way to customize the dashboard view.
Machine Detail Display

This button serves as a toggle, enabling users to switch the visibility of the machine detail section on and off the main dashboard display, providing flexibility in customizing the dashboard view.
Latest Report Display

This button functions as a toggle, allowing users to activate or deactivate the visibility of the machine’s latest report section on the main dashboard display, offering flexibility in customizing the dashboard view.
Verticle Menu


This button serves as a toggle to switch the visibility of the vertical menu section on and off the main dashboard display, providing users with the flexibility to customize their dashboard view.
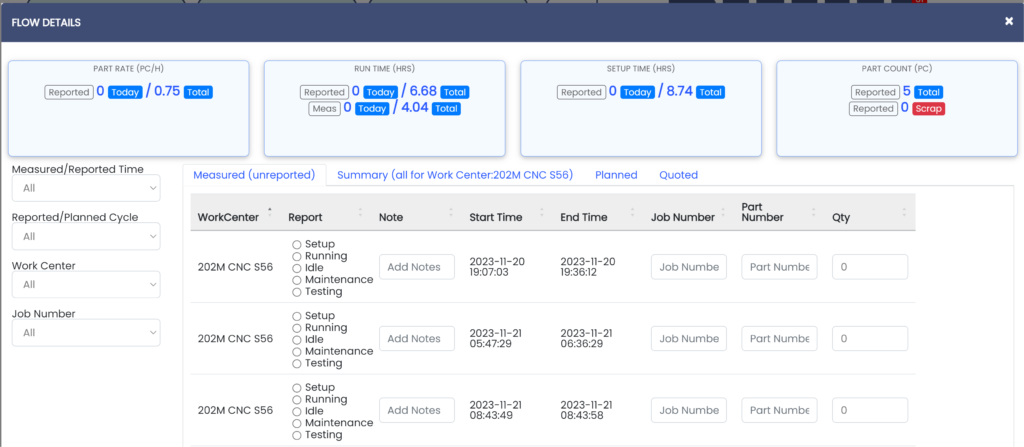
Data Filters

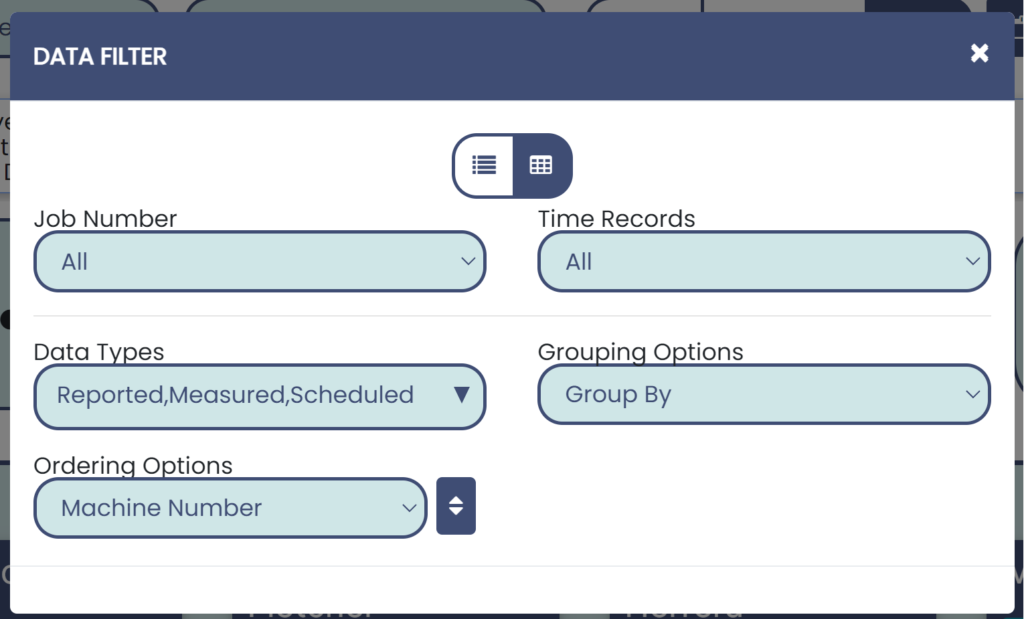
The button above activates a menu facilitating data filtration based on specified metrics, ensuring precision in tracking and processing for enhanced accuracy and efficiency.
- Job Number – Based on the system’s Machine cycles and job numbers.
- Time Record – Based on the dates and times of the shifts where the system was online.
- Data Types – Based on what data type is being filtered.
- Reported is when the machine has already reported the data and is in the system.
- Measured is when the data is currently being measured.
- Scheduled is for the planned and upcoming shifts.
- Grouping Options – Based on the Job type or the date for grouping purposes.
- Ordering Options – For presenting the data in the required order. The default list is below.
- Machine Number
- Machine Name
- Machine Hours
- Reported Hours
- Machine Group
Display Options

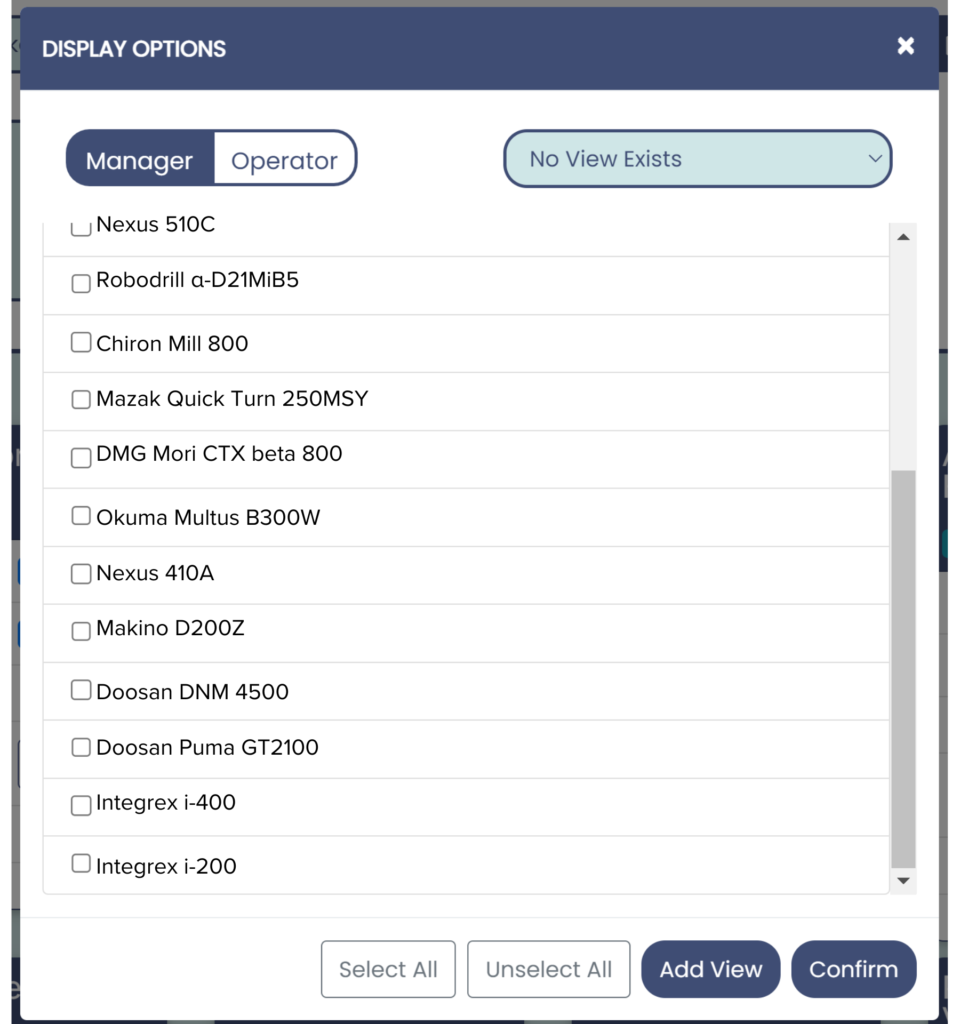
This menu presents options for selecting specific machines for display and a comprehensive list of all registered operators associated with those machines. Users have the capability to add these selections as views for future reference.
Notification Button

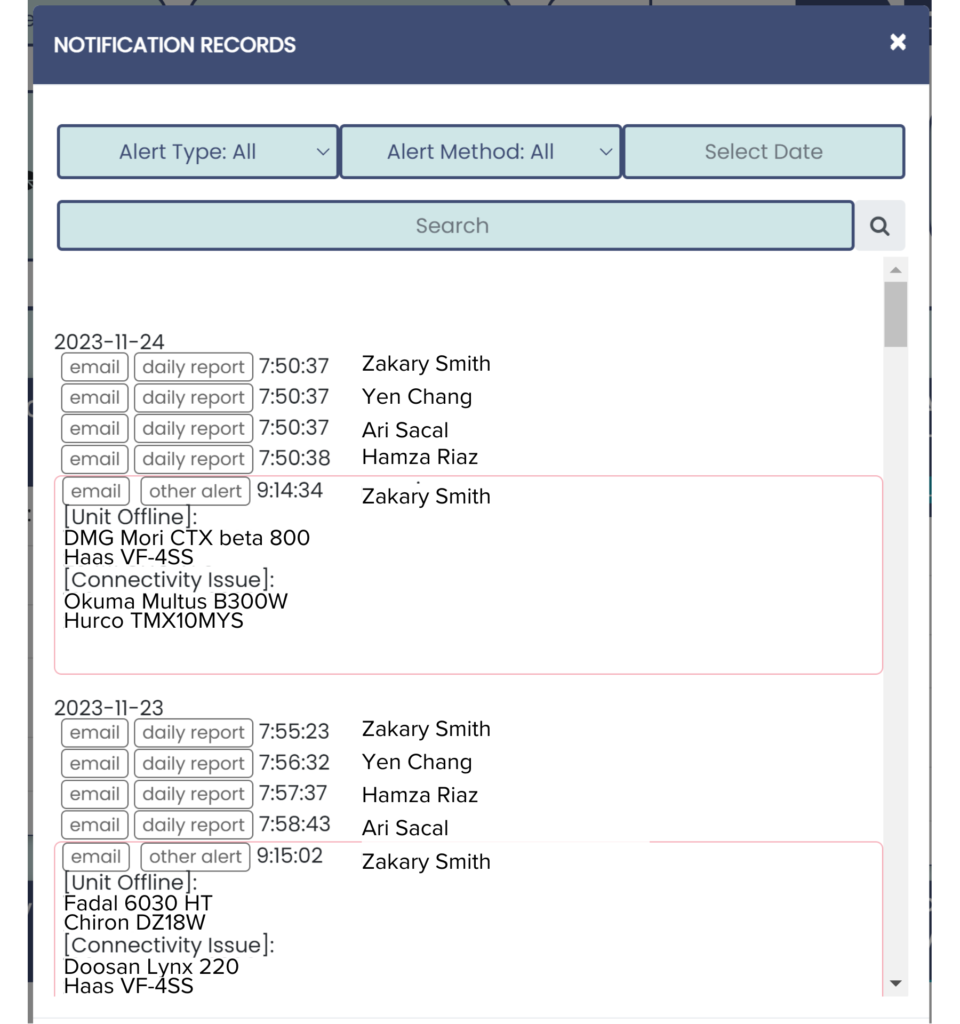
This section serves as the notification display, showcasing detailed information for each notification. Users can apply filters based on alert type, method, or the data associated with the notification arrival, allowing for efficient organization and retrieval of relevant information.
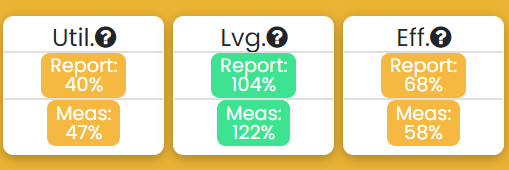
Utilization, Leverage, Efficiency Summary
These figures represent vital metrics for the overall assembly line, encompassing data for all machines and their respective operators. The detailed explanation for each number in this section is provided below for clarity and reference.

- Utilization – This is the percentage of the reported time of use of machines divided by their capacity to operate.
- Leverage – Reported machine hours divided by labor hours to get leverage of assembly line machines.
- Efficiency – This is the number reported for the efficiency of the assembly line for all the machines combined for their hours worked.
Employee Data
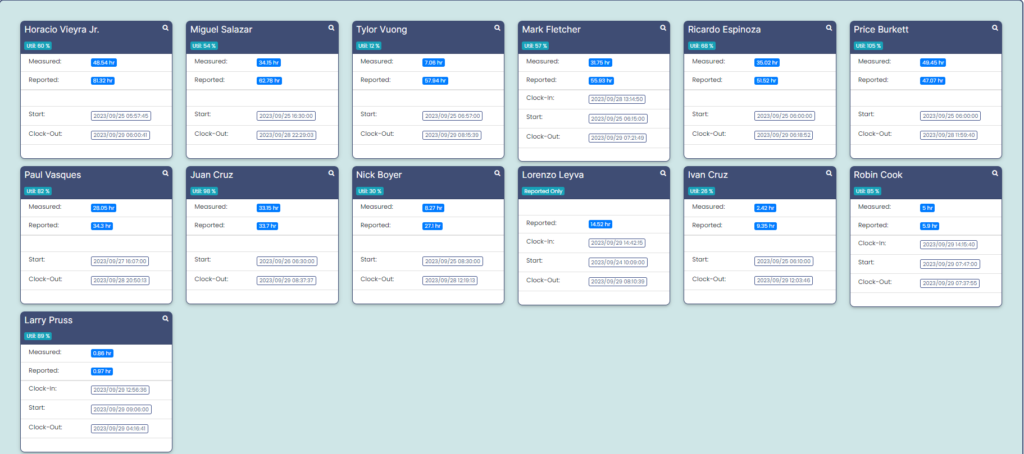
This panel comprehensively presents data on each operator, including their working time, the number of hours worked, and utilization metrics, providing a detailed overview of individual operator performance.
Clicking the magnifying glass (🔎) at the top corner of each operator activates a link to a dedicated tab, where a detailed report of the operator’s key performance indicators (KPIs) for the week is presented.
Alarm Records
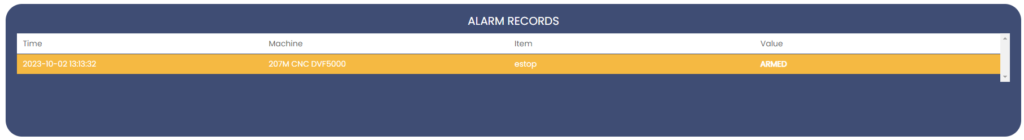
This section is the hub for receiving alerts regarding malfunctions or issues across all operational machines. It provides a centralized view of alarms for efficient monitoring and response.
Machine Records Section
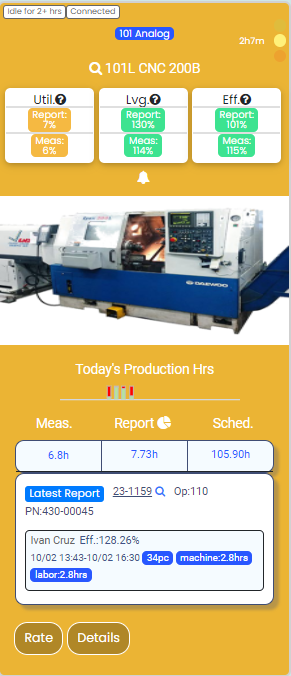
This section is a comprehensive data repository for each machine, including its name, operational time, and production hours. Detailed descriptions for each item within this section are provided above for reference and clarity.
A detailed description for each section has been provided above for your reference and understanding.

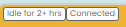
This section in the machine overview displays the idle time duration when the machine is in an active state, along with the connection status indicating whether it is currently connected.

This section outlines the methodology employed for data collection and specifies the type of sensor installed in the machine for monitoring and gathering relevant information.

This section provides information about the stop timer, indicating the duration since the machine was last active, along with an alarm icon highlighting any ongoing alarms. Upon the machine’s reactivation, the section displays the activity time and changes the background color to green, as illustrated above.

This Section refers to the machine code or the name given to the machine.
This section pertains to the machine’s utilization, efficiency, and leverage numbers, providing key metrics that contribute to an overall assessment of the machine’s performance.